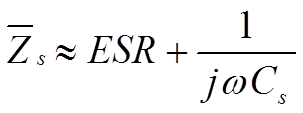
Rs consists of resistance in lead-in wires, contact surfaces, and metalized electrodes, where such elements occur, as well as dielectric losses. If we apply a DC voltage over the capacitor, the generator ”feels” a purely resistive loss dominated by the IR. But because of the high value of the IR the heat release will be negligible. Should we instead change over to an AC voltage and let the frequency rise the current will increase proportionally and eventually release a considerable heat in the Rs. If we transform the IR to a small series resistance with the help of formula C1-14 and join it with the Rs we get a total series resistance called ESR (Equivalent Series Resistance, sometimes called Effective Series Resistance). The series impedance, Zs, in the Figure above can be written:

As a root mean square value we obtain the formula:

(Ω)……………………… [C1-9]
The capacitive reactance, 1/ωC, in the formula above decreases with frequency to that level where the inductive reactance, L, takes over. It happens at the resonance frequency fo of the capacitor where 1/ωC = L. Above the resonance frequency the capacitor is inductive. Exactly at the resonance frequency remains of the impedance Z only the resistive ESR (Figure below the text). By determining the losses at the resonance frequency we gain accuracy. But there is a condition for this accuracy. We need to know the frequency dependence of the ESR which very much is conditioned by the dielectric material. In certain materials, it is negligible, in others considerable. Some guidance is obtainable through those frequency diagrams which sometimes are shown in this book for certain dielectric materials where this information is of importance.
The expression for capacitance in the formula for Zs above can be simplified to a series capacitance Cs. If C means the nominal capacitance, then we obtain Cs as
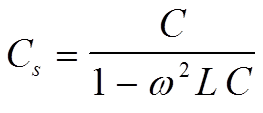
………………………… [C1-10]
and
………………………[C1-11]
Impedance around the resonance frequency [1]
Figure The impedance diagram of a capacitor above,
shows an example of the impedance diagram around the resonance frequency. We shall evolve the reasoning further.
Because of the approximations used during derivation of formula C1-10 it applies only far below the resonance frequency, f0. There, however it may cause discernible deviations from the true value. Already at 0.2 x f0 Cs will be approximately 4% greater than the nominal value C.
Often the expression for Cs is used when the frequency dependence of capacitance is shown in diagrams. This means that the capacitance quite contrary to physical and electrical laws starts rising at higher frequencies. The explanation accordingly is to be sought in errors in the measurement method.
In capacitors with relatively high losses, for example, electrolytes, the impedance curves reach and are influenced by these losses long before we get to the resonance frequency. A frequency dependent decrease in capacitance may also play a certain role in the frequency range. The impedance curve will deviate from the initial reactance curve and level out in a pliable bend on the ESR contribution, high above the point of intersection between the capacitive and inductive branch. The phenomenon is illur;”>strated in Figure shows below.

Figure: The appearance of the impedance vs. frequency curve around the resonance frequency of high-loss capacitors.

Figure: Circuit diagram of a capacitor
- C = Capacitance.
- IR = Insulation Resistance (IR>>Rs).
- Rs = Series losses.
- L = Inductance in lead-in wires.

Figure: Circuit diagram of a capacitor
The equivalent circuit diagram then looks like the one in this Figure

Figure: The equivalent series circuit diagram of a capacitor. Valid at higher frequencies.
Except for electrolytics and other high loss capacitors the impedance curve usually has the appearance of the one shown in this Figure

Figure: The appearance of the impedance vs. frequency curve around the resonance frequency in low-loss capacitors.
Loss Dependent Derating
The heat release from AC applications limits the temperature range of, for example, paper capacitors, where the loss raises the internal temperature appreciably. While DC applications, for example, allow +85 or +100°C AC applications already at 50 Hz may require limitations to maximum +70°C. Higher frequencies require further derating because of the current, which grows correspondingly. The R.M.S. value of the AC voltage furthermore is derated according to the permitted DC value not only with respect to the peak value and the temperature rise but also because of the additional strain that every repolarization exerts on the dielectric. The higher the rated voltage, the higher the degree of derating. Example: AC/DC = 40/63, 63/100, 125/250, 220/400, 300/630, 500/1000, 660/1600. But please, always check what the relevant data sheets specify.
Dissipation Factor (DF) / Tanδ
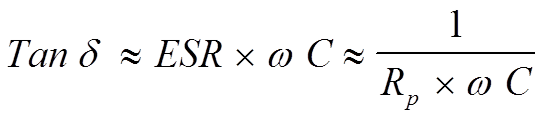
The losses in Figure named as The equivalent series circuit diagram of a capacitor. Valid at higher frequencies, are concentrated to the ESR which consequently becomes significant when we leave the low-frequency range. For HF chips and high loss components, such as electrolytic, often the ESR is stated in the data sheets. If the ESR information is missing, you always find, for all component types, a specified dissipation factor (DF), the tanδ (look at Figure on the right).
Hence, at higher frequencies, the series circuit according to Figure. The equivalent series circuit diagram of a capacitor. Valid at higher frequencies. applies. There is
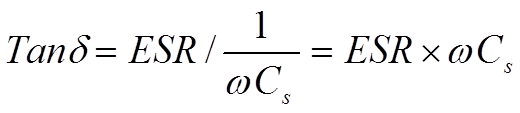
……………….. [C1-12]
Tanδ usually is expressed in %.
If the frequency declines to zero, the circuit becomes resistive, without any capacitance, and the losses are limited to the IR. Also at very low frequencies, the IR is predominant but here it should be completed with dawning AC dependent losses to an equivalent loss resistance Rp. The diagram in the first Figure in this post now can be simplified to a parallel circuit with the capacitance Cp (Figure shows on the right side).
If we describe the impedance in a parallel circuit according to Figure above, it’s easy to show that its dissipation factor – which applies at low frequencies – can be written as
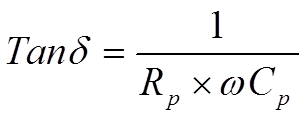
……………………………[C1-13]
The difference between Cs and Cp is usually negligible. We shall return to the connections in some formulas. If we equate the formula C1-10 with C1-11 we obtain
 ;
;
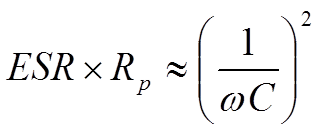 ……………………………[C1-14]

Figure: Definition of Tanδ in a series circuit.

Figure: The equivalent parallel circuit of a capacitor. Applies at low frequencies.
Let us terminate the discussion about the capacitor losses by distinguishing the different types of losses as in the following Figure:

Figure: Equivalent diagram with dielectric losses particularly marked.
- Rd = dielectric losses;
- Rs = losses in leading-in wires, joints and electrode metallizations;
- ESR = Rs + Rd;
- C = C1 + C2.
Q value
Sometimes we encounter the expression Q or Q value, especially in high-frequency applications. Instead of describing the capacitor losses as DF (Tanδ) we rather specify its freedom from losses, its figure of merit, the Q value. It is defined as
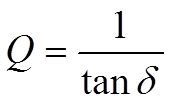
…………………….[C1-15]
Typical Q values for ceramic Class 1 dielectrics range from 200 to 2000 at 100 MHz and will vary strongly with frequency.
We shall use the Q value to describe the connection between the quantities in the series and parallel circuits in Figure C1-18 and -20. By depicting the expressions for the impedances and Q values of these circuits and equate the real and imaginary parts of the impedances we can show that

………………………………[C1-16]
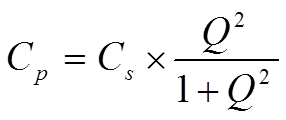
………………………………[C1-17]
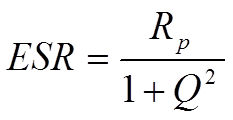
…………………………………….[C1-18]
![]()
……………………………[C1-19]
Loss versus Frequency
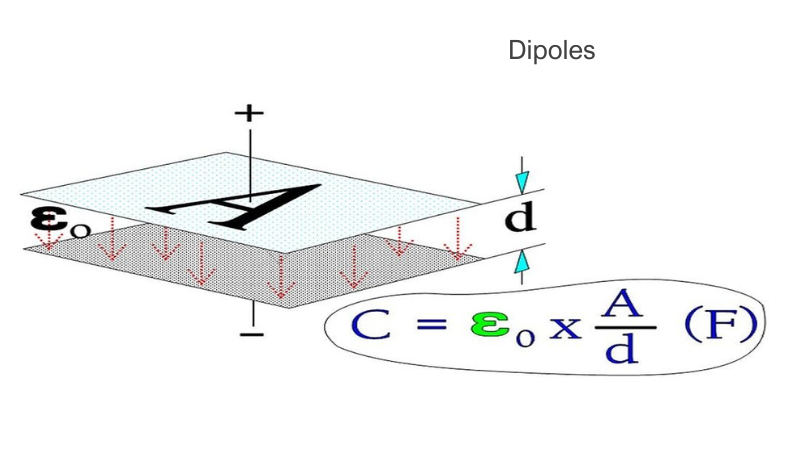
The figure on the right side illustrates the behavior of different dielectric dipoles when they are affected by an alternating field. They will oscillate at the same frequency as the field’s if allowed by their reaction time. Every rotary motion requires energy and the executed work produces heat. The most inert dipoles will react to the very low frequencies and will here contribute to the losses. But as the frequency increases the different types of dipoles will not be able to respond quickly enough, one after another, as shown in the figure.
Just in the range where the reaction time of the dipoles and the frequency period coincide, a kind of resonance occurs which causes the dipole types to react with a loss peak (Figure above).
Observe that the Figure named before deals with dipole losses, nothing else. Other dielectric materials have no molecular dipoles. They are called non-polar, while the others are called polar. This has nothing to do with the polarity dependence of electrolytes.
The sum of losses in a polar and a non-polar capacitor may look like the ones in the next Figure.
[1] The one who wants to study the subject on behavior of capacitors around the resonance frequency more closely is recommended the CARTS 99 paper A Capacitor’s Inductance, by Dr. Gary Ewell and Bob Stevenson, PE.

Figure: Dipole losses versus frequency.

Figure: Total losses versus frequency in a polar and non-polar dielectric material.
Author:
EPCI | Bringing Passive Professionals Together
Related Articles
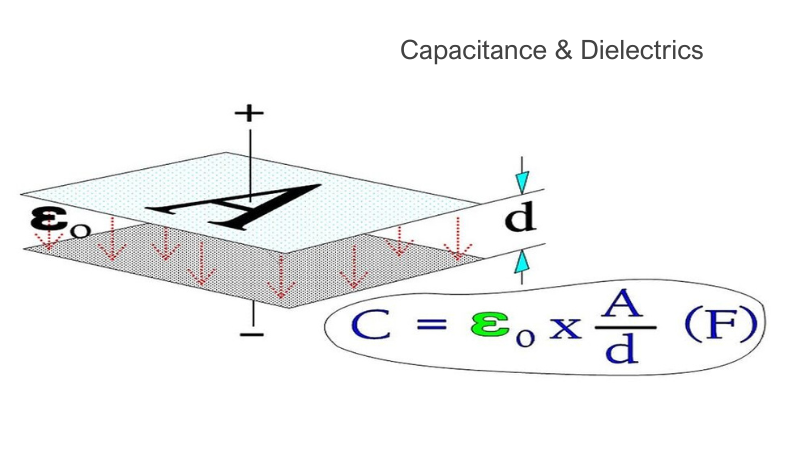
Capacitance & Dielectrics
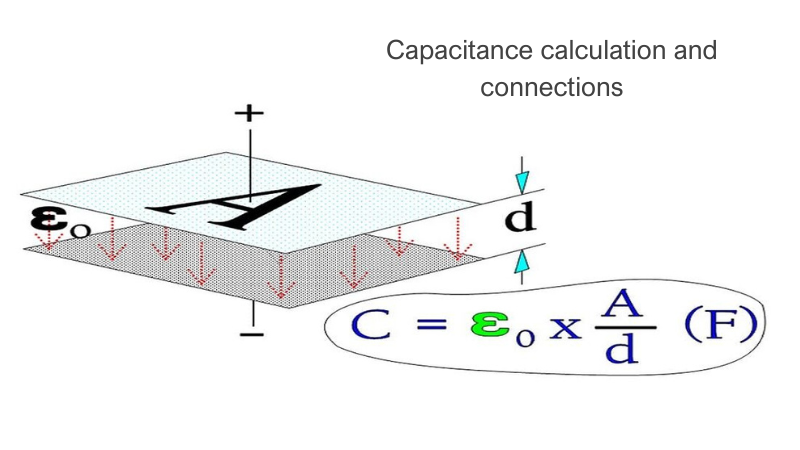
Capacitance calculation and connections