This article is the first of a complete installment on the in-depth analysis of capacitor losses. It provides an in-depth analysis of various capacitor losses, including Impedance (IMP) and Equivalent Series Resistance (ESR), fundamental parameters for understanding how components behave in circuits.
The complete analysis is divided into 4 stages:
- Capacitor Losses (IMP and ESR)
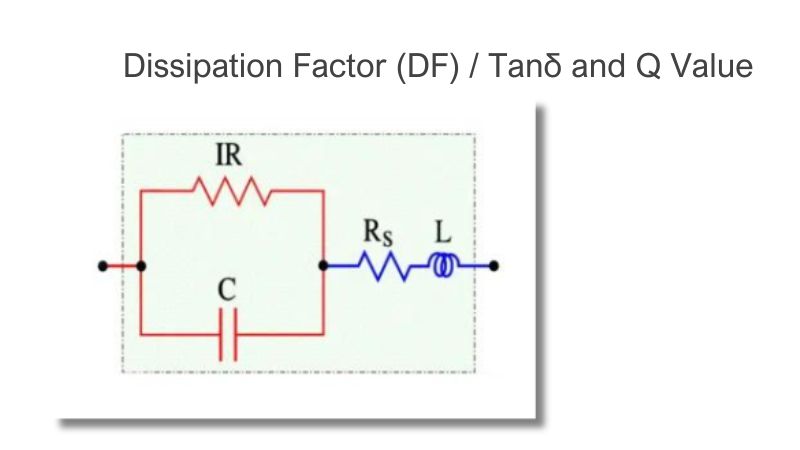
- Dissipation Factor (DF) / Tanδ and Q Value
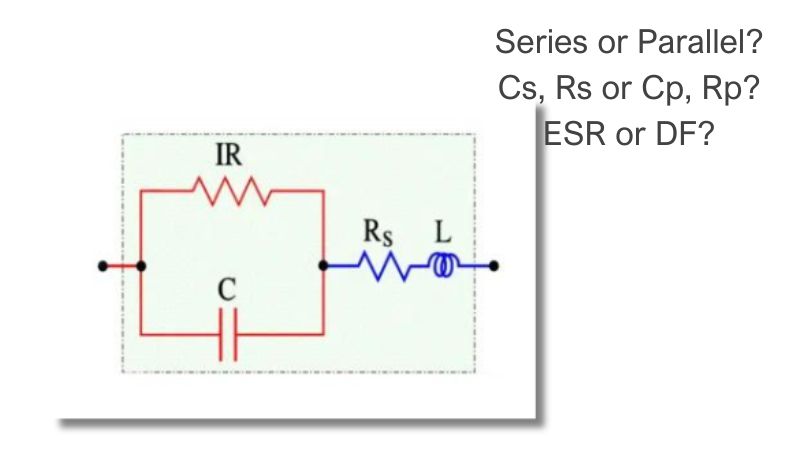
- Series or Parallel? Cs, Rs or Cp, Rp? ESR or DF?
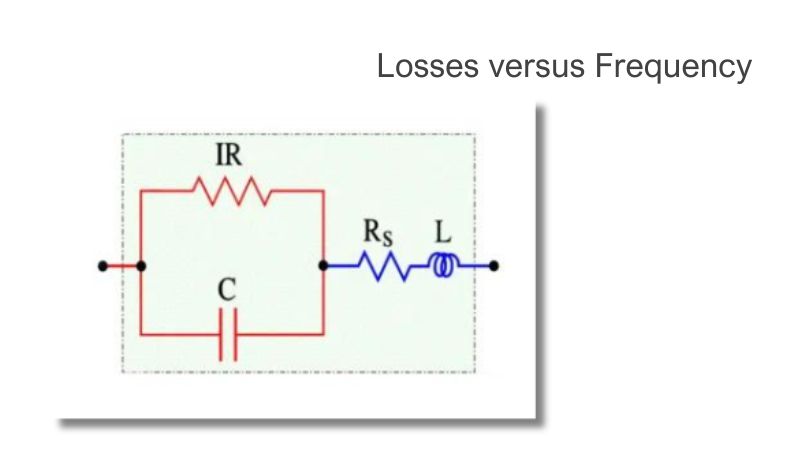
- Losses versus Frequency
Capacitor losses (ESR, IMP, DF, Q), series or parallel Eq. Circuit?
There are two types of losses:
- Resistive real losses – these are real losses caused by the resistance of leads, electrodes, connections, etc. During current flow, these losses are dissipated by Joule heat. Usually (unless it is intended by design) the effort is to minimize these losses for maximum efficiency and high power load ratings.
- Reactance imagine losses – these are losses caused by capacitive reactance and inductive reactance “stored” in the component that can be reverted back
A capacitor creates in AC circuits a resistance, the capacitive reactance. There is also certain inductance in the capacitor. In AC circuits, it produces an inductive reactance that tries to neutralize the capacitive one. Finally, the capacitor has resistive losses. Together these three elements produce the impedance, Z.
If we apply an AC voltage over a capacitor, its losses release heat. They can be regarded as a resistive part of the impedance, i.e., as resistive elements distributed in different parts of the component, e.g. in accordance with the equivalent circuit in Figure 1.

Figure 1. Circuit diagram of a capacitor
- C = Capacitance
- IR = Insulation Resistance (IR>>Rs)
- Rs = Series losses
- L = Inductance in lead-in wires
Figure 1. Circuit diagram of a capacitor
- C = Capacitance
- IR = Insulation Resistance (IR>>Rs)
- Rs = Series losses
- L = Inductance in lead-in wires
Rs consists of resistance in lead-in wires, contact surfaces, and metalized electrodes, where such elements occur, and dielectric losses. If we apply a DC voltage over the capacitor, the generator ”feels” a purely resistive loss dominated by the IR. But because of the high value of the IR, the heat release will be negligible. If we change over to an AC voltage and let the frequency rise, the current will increase proportionally and eventually release considerable heat in the Rs. Suppose we transform the IR to a small series resistance and join it with the Rs. In that case, we get a total series resistance called ESR (Equivalent Series Resistance, sometimes called Effective Series Resistance). The series impedance, Zs, in Figure 1. can be written:

As a root mean square value, we obtain the formula:

(Ω)……………………… [1]
The capacitive reactance, 1/ωC, in the formula above decreases with frequency to that level where the inductive reactance, L, takes over. It happens at the resonance frequency fo of the capacitor where 1/ωC = L. Above the resonance frequency, the capacitor is inductive. Exactly at the resonance frequency remains the impedance Z only the resistive ESR (Figure 2.). By determining the losses at the resonance frequency, we gain accuracy. But there is a condition for this accuracy. We need to know the frequency dependence of the ESR, which is very much conditioned by the dielectric material. It isn’t very important in certain materials, but in others considerable

Figure 2. The impedance diagram of a capacitor
The expression for capacitance in the formula for Zs above can be simplified to a series capacitance Cs. If C means the nominal capacitance then we obtain Cs as

………………………… [2]

………………………… [3]
The equivalent circuit diagram then looks like the one in Figure 3.

Figure 3. The equivalent series circuit diagram of a capacitor. Valid at higher frequencies
Impedance around the resonance frequency
Figure 2. shows an example of the impedance diagram around the resonance frequency. We shall evolve the reasoning further.
Because of the approximations used during the derivation of the formula [2] it applies only far below the resonance frequency, f0. There, however, it may cause discernible deviations from the true value. Already at 0.2 x f0 Cs will be approximately 4% greater than the nominal value C.
Often the expression for Cs is used when the frequency dependence of capacitance is shown in diagrams. This means that the capacitance quite contrary to physical and electrical laws, starts rising at higher frequencies. The explanation accordingly is to be sought for errors in the measurement method.
Except for electrolytes and other high-loss capacitors, the impedance curve usually has the appearance of the one shown in Figure 4.

Figure 4. The appearance of the impedance vs. frequency curve around the resonance frequency in low-loss capacitors
The sharp tip at the resonance frequency is typical for capacitors with comparatively small losses. In this frequency range, the impedance contribution from the ESR is smaller than those of the capacitive and inductive reactances. When the decreasing capacitive reactance reaches the same magnitudes as those of the rising inductive reactance, the latter will have an increasing influence. It reduces the capacitive reactance and eventually eliminates it. The curve bends down in a sharp tip. The ESR determines the bottom of the bend.

Figure 5. The appearance of the impedance vs. frequency curve around the resonance frequency of high-loss capacitors
In capacitors with relatively high losses, for example, electrolytes, the impedance curves reach and are influenced by these losses long before we get to the resonance frequency. A frequency-dependent decrease in capacitance may also play a certain role in the frequency range. The impedance curve will deviate from the initial reactance curve and level out in a pliable bend on the ESR contribution, high above the point of intersection between the capacitive and inductive branches. The phenomenon is illustrated in Figure 5.
Loss Dependent Derating
The heat release from AC applications limits the temperature range of paper capacitors, where the loss raises the internal temperature appreciably. While DC applications allow +85 or +100°C, AC applications already at 50 Hz may require limitations to a maximum of +70°C.
Higher frequencies require further derating because of the current, which grows correspondingly. The R.M.S. value of the AC voltage furthermore is derated according to the permitted DC value not only concerning the peak value and the temperature rise but also because of the additional strain that every repolarization exerts on the dielectric. The higher the rated voltage, the higher the degree of derating.
Example: AC/DC = 40/63, 63/100, 125/250, 220/400, 300/630, 500/1000, 660/1600. But please, always check what the relevant data sheets specify.
Continue reading at: 2. Dissipation Factor (DF) / Tanδ and Q Value.
Related Articles
Dissipation Factor (DF) / Tanδ and Q Value
Series or Parallel? Cs, Rs or Cp, Rp? ESR or DF?